Enrolment options
Learn about representing data, undertand what data is and why it is important to represent it. This course is ideal for beginners.
Introduction
Data is information: a collection of numbers, words, measurements, facts and statistics.Data is not useful unless presented in an appropriate way.
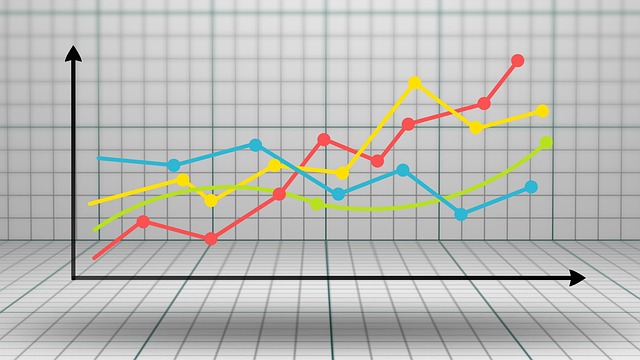
Data is the basis for the creation of charts and graphs.
A visual representation of data allows:
- Easier
extraction and interpretation of information
- Comparison
between the different elements of the data
- Presentation
of large pieces of information in a small space
You will learn
- Understand what data is and why it is important to represent it
- Distinguish between the most common visual representations of data
- Identify what a bar chart, a pie chart and a line graph are
- Read charts and graphs accurately
Guests cannot access this course. Please log in.